
The first 100K by trading options
There are many “profound” strategies from “successful” TikTok investors. Usually, they’re about as useful as a chocolate teapot or just too cryptic to make any sense. Check them out here: https://twitter.com/TikTokInvestors. In this post, I want to concentrate on my trading strategy to get the first $100,000. I hope it will not become as “profound” in the upcoming years of implementation.
There is one gem from Charlie Munger, who I largely admire, the pinnacle of investment, leveraging compounding:
The first $100,000 is a bitch, but you gotta do it. I don’t care what you have to do – if it means walking everywhere and not eating anything that wasn’t purchased with a coupon, find a way to get your hands on $100,000. After that, you can ease off the gas a little bit. Charlie Munger
Intro
The initial phase of wealth accumulation is often the most challenging, but it establishes a solid foundation for subsequent financial growth. Here are several reasons why reaching the first $100,000 milestone is particularly crucial.
Reason #1 Compounding. The most important one.
To demonstrate compounding, let’s assume that we start with an initial investment of $5,000 and contribute an additional $1,000 each month. With a 9% SnP annual return, we can calculate the future value of the investments after each month using the following formula:
FV = P * (1 + r/12)^n + MC * (((1 + r/12)^n - 1) / (r/12))

Where:
FV - the future value of the investment
P - initial principal
r - annual interest rate (as a decimal, e.g., 9% is 0.09)
n - number of months
MC - monthly contribution
This formula calculates the total value of the investment after a specified number of months, taking into account both the initial principal and the regular monthly contributions, compounded monthly at the given annual interest rate.
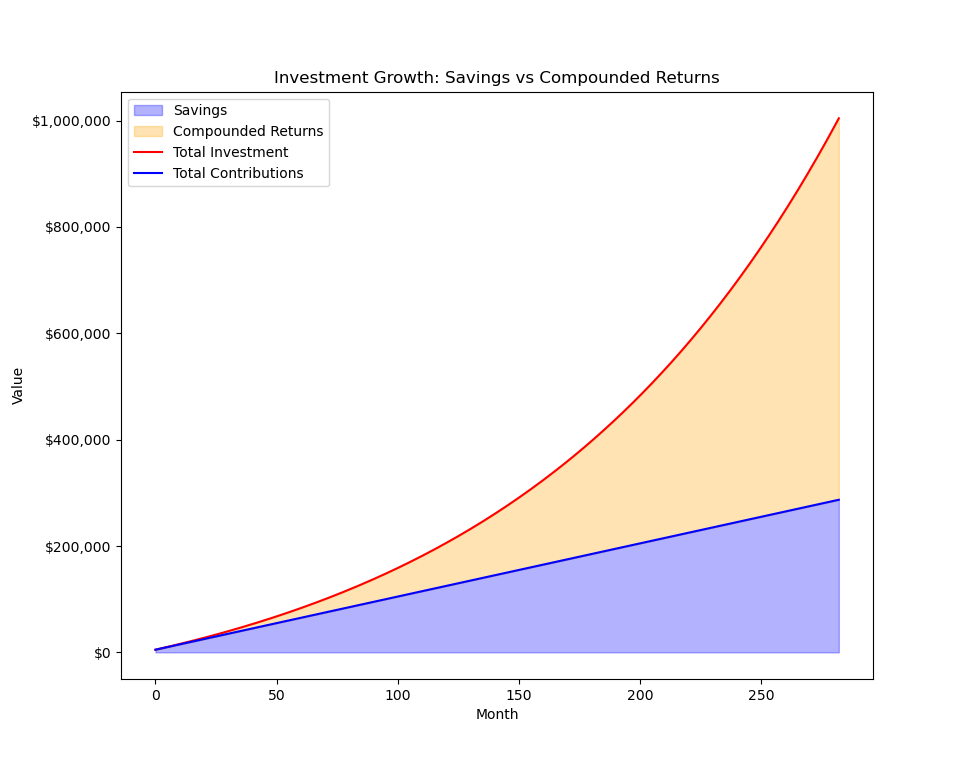
As can be seen from Figure python visualization code the compounding after $100,000 starts to accelerate, before $100,000 the compounding effect is not so pronounced and the majority of growth comes from savings (the blue and orange lines are almost the same). By leveraging compounding and regular contributions of 1K each month, the 100K mark can be reached in only 6-7 years in an absolutely passive, hassle-free way.
Reason #2 Diversification
With a larger sum of money, there is more flexibility in investment choices. It is possible to diversify across different asset classes, industries, and individual investments, potentially reducing risk and increasing returns. It means that in case of failure of one company, the account will not be wiped out. It is much easier to diversify in different sectors with a large sum of money compared to a small account. Simply put, big account gives more security.
Reason #3 Learning and experience
Saving and investing enough to reach the $100,000 milestone requires cultivating good financial habits, such as consistently saving a portion of the income, and making informed money decisions.
I want it faster! Wheeling the F.
We established that 100K is an important goal toward financial freedom and with good financial discipline can be achieved in 6-7 years of savings in a good market. Now let’s discuss how to get to the 100K by means of trading options.
My favorite strategy for investment is the Wheel, as it is generally safe and conservative compared to other options strategies and can provide similar returns as SPY but in a more predictable way.
The wheel, also known as the cash-secured put and covered call strategy, is an options trading strategy that involves selling options to generate income. The strategy consists of two main steps:
- Sell cash-secured put options. First, you sell a put option on a stock you’re willing to own. You receive a premium for selling the option, and you’re obligated to buy the stock at the strike price if the option is exercised (i.e. if the stock’s price falls below the strike price). To secure this obligation, you set aside cash in your account equal to the strike price multiplied by the number of shares in the contract (typically 100 shares per contract).
- Sell covered calls. If the put option is exercised and you end up buying the stock, the next step is to sell a call option on the same stock. This call option is “covered” because you own the underlying stock. By selling the call option, you receive a premium and commit to selling the stock at the strike price if the option is exercised (i.e. if the stock’s price rises above the strike price).
The primary risks are potential losses if the stock’s price falls significantly (in the case of selling puts) or if the stock’s price rises substantially, and you miss out on the gains (in the case of selling covered calls).
I like to sell 30-45 days weeklies, using 50% for a profit and -100% for the stop loss. One of my favorite stocks is F, which pays good dividends, is relatively stable, has high Implied Volatility and pays dividends.
Let’s do a rough estimation applying a wheel options trading strategy to reach 100K goals by a combination of saving and trading. It is a simplified example that doesn’t account for changes in market conditions, stock performance, or the potential risks involved in using leverage.
How long will it take for me to achieve 100k if I use the wheel strategy for options in F and add 1000 USD per month?
The outcome heavily depends on the stock, option premiums, strike price, and market conditions. It’s impossible to provide an exact timeline for when to achieve $100,000. To estimate the time it might take, let’s consider the following:
| Starting balance: | $5,000 |
| Leverage: | 2x |
| Available capital: | $5,000 x 2 = $10,000 |
| Monthly contribution: | $1,000 |
Let’s assume it is possible to generate an average of $30 in option premium per contract and that we have access to entire available capital ($10,000) each month to sell options. Now, let’s estimate how long it will take to reach $100,000. We’ll use the future value of a series of cash flows formula:
FV = P * (((1 + r)^n - 1) / r)

Where:

FV - future value
P - periodic payment (monthly investment)
r - periodic interest rate (monthly return)
n - number of periods (months)
We should also take into account a yearly tax of 15% on the profit (for Hungary) and 1$ of commission per contract (IBKR).
- Calculate the commission cost per month: 10 contracts x $1 = $10
- Calculate the monthly option premium income after commission: $300 (option premium income) - $10 (commission) = $290
-
Calculate the total monthly investment:
$1,000 (monthly contribution) + $290 (option premium income after commission) = $1,290
For simplicity, we’ll assume a constant 3% monthly return (0.03) on the total investment, although this may not be realistic:
$100,000 = $1,290 * (((1 + 0.03)^n - 1) / 0.03)
Solving for n, we get approximately 26 months.
Now, let’s account for the 15% yearly tax on profits:
- Year 1: After 12 months, we would have made approximately $15,480 ($1,290 * 12 months) in total investments, including option premiums and contributions.
- Year 1 Tax: Assuming a constant 3% monthly return, the profit in year 1 would be $15,480 - $12,000 (12 months * $1,000 monthly contribution) = $3,480. The tax on this profit would be $3,480 * 0.15 = $522.
- Year 1 After Tax: $15,480 - $522 = $14,958 By the end of year 2 (24 months), we would have approximately $29,916 ($14,958 * 2). In the 3rd year, we will reach $100,000. It is a very optimistic scenario, in reality, there will be failed trades, the usual success rate is around 60-70% for my trades. 3% return per month equals 36% year return. 1% per month is a much more realistic expectation.
How much the monthly contribution influences the time to get to the 100k?
The approximate number of months it would take to reach $100,000 for each scenario, assuming a 3% average monthly return (optimistic), 15% yearly tax on profit, and $1 commission per contract. The initial balance is $5,000 and 2x leverage as previously mentioned is used.
| Monthly Contribution | Months to Reach $100,000 | Years to Reach $100,000 |
| $100 | 54 | 4.5 |
| $500 | 46 | 3.83 |
| $1,000 | 39 | 3.25 |
| $1,500 | 34 | 2.83 |
| $2,000 | 30 | 2.5 |
According to the calculations, the sweet spot is $1000 saving rate per month. Saving $2000 more shortens the time for 9 months but requires much more effort.
This is a rough estimation and doesn’t account for changes in market conditions, stock performance, or the risks associated with using leverage.
You can simulate options return (assuming monthly compounding) in the calculator below.
Visualizing Investment Returns
X-Axis (Time in Years). The x-axis of the graph represents the time period of the investment in years. It starts from 0 and extends up to the number of years entered as input. The axis adjusts dynamically as the number of years is changed by the user.
Y-Axis (Investment Value). The y-axis of the graph represents the total value of the investment. It also scales dynamically based on the data. The investment value is calculated by taking into account the initial investment, monthly contributions, compounded returns, and annual tax deductions.
Savings Area (in light green). This is a colored area on the graph that represents the value of your principal plus any additional monthly contributions over time, without accounting for any returns on the investment. This value increases linearly as you keep adding the monthly contributions.
Returns Area (in orange). This is another colored area that covers the gap between the savings area and the line representing the total investment value. It represents the returns you are getting on your investment. This area grows larger with time as the effect of compound interest becomes more significant.
Investment Value Line (in blue). This line represents the total value of your investment over time. It is calculated by adding the monthly contributions and the returns (including the effect of compounding), and subtracting the tax.
SPY returns (in red): Used as benchmark, 10% annual return is assumed.
By comparing the savings area with the returns area, you can clearly visualize the impact of your return rate on your investment over time. The wider the returns area becomes (compared to the savings area), the more earnings you are generating from your investment.
Likewise, by observing the movement of the investment value line, you can see the overall growth of your investment, including the effects of compounding, contributions, and taxation. The dynamic nature of the graph lets you instantly see how changes in the investment parameters affect your returns and overall investment growth.
Risks
Does the Options way worth the trouble? As established at the beginning of the post, passive investment can allow achieving 100k in 5-7 years in a low-risk way, compared to the conservative options trading method which can generate 100k in 3 years but is much more riskier. I am using F as an example.
What can go wrong when wheeling F?
Significant price drop
If Ford’s stock price drops significantly, you could be left holding the shares at a loss for a long time. While it is possible to sell covered calls to generate income, it might take a long time to recover the initial investment.
Slow recovery
If Ford’s stock price takes a long time to recover after a price drop, it could lead to reduced premiums on the options. (30 per contract is not guaranteed)
Dividend cuts or suspension
If Ford cuts or suspends its dividends, it could impact the stock price.
Reduced liquidity
If Ford’s options become less liquid, it might be harder to enter and exit positions at favorable prices. This could lead to lower profits or even losses. It is important to pick liquid stocks for reading.
Risk mitigation
- Position risk TBA
- Beta weighting TBA
- Diversify. Use wheel strategy across multiple stocks or sectors to minimize the potential impact of a single stock’s performance on a portfolio.
Here is my risk mitigation plan for selling options to reach 100,000 in the investment account.
- Save $5000 which I am ready to lose. In my opinion, trading options with less than 5000 is time-consuming with low returns. Not worth the trouble. Better to just put it into a good ETF.
- At $5,000 to $10,000 sell CSPs (cash-secured puts) on Ford, make ~$30/month, and when assigned, practice the wheel. The initial goal with $5000 is to have running two CSPs on liquid stocks < $25 With $10,000 it is possible to manage 5 different positions in 5 uncorrelated companies/products, ideally with no single company with more than 20% dominance of the portfolio. I am trying not to manage more than 5 company stocks at once, as it is easy to lose track.
- Above $10,000 Start adding put Credit Spreads on indexes.
- Above $20,000 The goal at this point is to get individual exposure down to 5% per company and run CSP/Credit Speadds and Wheels on indexes.
My general rules for selling Options
- Sell weeklies (30-45 days until expiration) and delta 0.30 or lower. Read more about delta and theta here:theta, delta In very simple terms, 0.3 delta call option gives about a 70% chance of success.
- Set the profit taking at +50% and cutting losses at -100% for each trade.
- Do not hold a naked put position during earnings or other significant stock events. I was burned before when stock swung violently in earnings, which resulted in losses. Selling puts into earnings is a gamble.
Please be free to use my Option vs. SPY Return Calculator - a tool designed to assist option sellers in making informed decisions. It allows us to compare the potential return of selling an option versus investing the same amount of capital into the S&P 500 ETF (SPY).
Selling Option vs. SPY Return Calculator
About the Calculator
Our calculator takes into consideration important metrics like the option strike price, option price, time to expiration, and trading commission. It also includes a configurable SPY annual growth rate, allowing you to set your expectation of SPY growth, with options ranging from 5% to 20%.
How it Works
Here's a quick overview of how the calculations are made:
- The calculator first computes the daily return you'd get from selling the option, taking into account the net option premium (option price minus commission) and the total amount of capital required (strike price x 100 shares) for the duration until the option's expiration.
- It then calculates the potential daily return from investing the same amount of capital in SPY shares, considering the annual growth rate you've set.
- Finally, it compares these two daily returns and provides a verdict on whether it might be more beneficial to sell the option or invest in SPY.
Why Use This Calculator
This tool is particularly handy for those who sell options but also consider alternative investment strategies, such as passive investing in index funds like SPY. It provides a quantitative perspective on whether selling a particular option is worth it compared to simply investing in SPY, given your assumptions about its annual growth.
We hope this calculator will assist you in your trading decisions and help optimize your investing strategies. Please keep in mind that all investments carry risks, and past performance does not guarantee future results. Always do your research. Happy trading!
- Self-employed in Hungary, Tax Calculator 2022